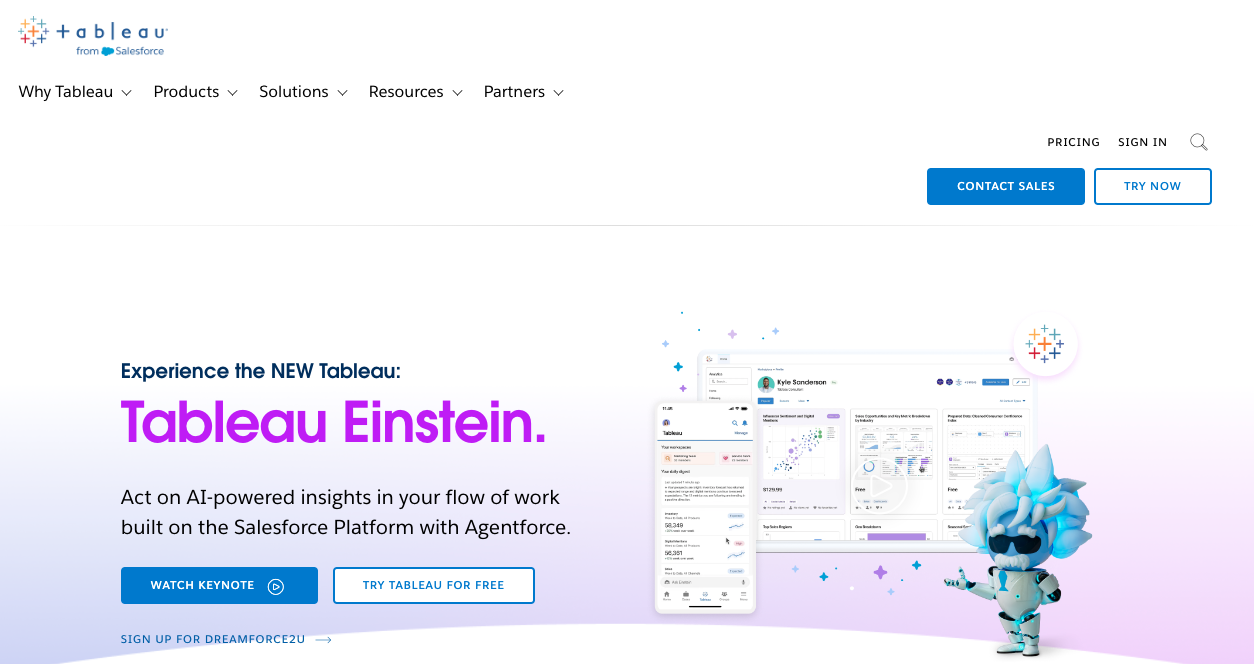
What is Tableau
Tableau is a powerful data visualization tool that transforms raw data into visually compelling stories. Designed for users of all technical backgrounds, Tableau makes it easy for individuals and organizations to explore, analyze, and share insights. Its intuitive drag-and-drop interface lets users create interactive dashboards, charts, and graphs that uncover trends, patterns, and meaningful information hidden within complex data sets. Whether you're an experienced analyst or a business professional looking to make data-driven decisions, Tableau provides the tools to turn your data into actionable knowledge.
How does Tableau work?
Tableau is a powerful data visualization tool that makes it easy to turn raw data into actionable insights. Here are the key steps to using Tableau:
- Data Connection: Tableau connects to various data sources, including databases, spreadsheets, and cloud apps. Just provide the necessary credentials to access the data.
- Data Exploration: Explore your data with a simple drag-and-drop interface. Create visualizations like bar charts, line charts, and maps, and use filters to refine and view data from different angles.
- Analysis and Insights: Perform calculations like averages, sums, and percentages to gain insights from your data. Identify trends, and patterns, and create visual stories to communicate your findings easily.
- Dashboard Creation: Combine multiple visualizations into a single dashboard to get a complete view. Improve user engagement by adding interactive features like filters, tooltips, and drill-down options.
- Sharing and Collaboration: Publish dashboards to Tableau Server or Tableau Public for easy sharing and access. Collaborate with colleagues to share insights and work on projects together.
- Real-Time Updates: Connect to live data sources for real-time analysis and updates. Set up automatic refreshes to keep your dashboards up to date at specified intervals.
Technical Highlights:
- Data Connectivity: Tableau business intelligence tool can easily connect with your different data sources, like spreadsheets, databases, or online services. This makes the analysis and use of your data easier.
- Drag-and-Drop Interface: Its drag-and-drop interface allows users to create visually appealing charts and graphs with minimal effort.
- Interactive Dashboards: With Tableau you can create interactive dashboards where you can click the elements and get more detail on it. You just need one click to explore your data.
- Advanced Analytics and AI: Tableau with its smart tools will allow you to dig deeper into your data and see important trends and patterns easily and quickly.
- Seamless Collaboration: With the sharing and teamwork features, the team members can easily collaborate leading to information sharing.
Features
- User-Friendly Interface: Tableau’s user-friendly interface allows you to visualize and explore data, helping teams make the most of data analytics.
- Data Integration: Tableau is a data visualization tool that connects to live data sources, keeping your dashboards and visualizations updated. This allows you to make informed decisions based on the latest information.
- Extensive Visualization Options: With a variety of visualization types - charts, graphs, maps, and dashboards. Tableau lets you choose the best way to present your insights effectively.
- Data Blending and Preparation: Tableau makes it easier to combine data from different sources, allowing you to mix data sets, clean and prepare data, and create custom calculations for your analysis needs.
- Strong Mobile Capabilities: Tableau offers strong mobile support, enabling you to access and interact with your dashboards anywhere, keeping you connected to your data and informed wherever you are.
Benefits
- Easy Understanding: Tableau, a data visualization tool helps you understand complicated information easily, without any hassle.
- Quick Insights: With Tableau, you can quickly find important insights in your data, saving time and effort when figuring things out and making decisions faster.
- Better Decisions: Tableau helps you make smarter decisions by showing your data in visuals, leading to better results for your business or project.
- Team Collaboration: Tableau lets teams work together easily, sharing what they find and ideas to reach goals and succeed.
- Flexible Solutions: Tableau gives you choices that fit your needs, making sure you get the most out of your data tools, no matter how big or small your project is.
Tableau is a powerful data visualization tool that helps organizations make the most of their data. Its user-friendly interface and advanced analytics allow individuals and teams to explore, analyze, and share insights easily. By using Tableau, businesses can make data-driven decisions, enhance efficiency, and gain a competitive edge in today’s data-focused environment.
Pricing
Tableau data visualization tool offers three packages for your team: Tableau, Enterprise, and Tableau+. For pricing details, you may Contact Sales.
Has Free Trial (14 days)
The latest revision of this document was made on 18 November, 2024.
Categories
Trending AI Tools
Explore other leading AI applications and platforms